since 1994...![]() network's service
network's service
You are in Home page » Products » Opensource » WebGUI » GDWGraph WebGUI Object

|
since 1994... You are in Home page » Products » Opensource » WebGUI » GDWGraph WebGUI Object |
|
GDWGraph: A Wobject to create graphs in WebGUI.Current version: 00.00.05/2005-01-17NOTE FOR USERSTHIS MODULE IS STILL IN VERSION ALPHA. UNTIL THE RELEASE OF FIRST DEFINITIVE VERSION (01.00.00) THIS COMPONENT MAY SUFFER OF HEAVY MODIFICATIONS. NO SCRIPT WILL BE RELEASED FOR UPGRADING FROM ONE VERSION ALPHA TO ANOTHER. OBVIOUSLY THIS COMPONENT MUST NOT BE USED IN PRODUCTION ENVIRONMENT. YOU ARE INVITES TO INSTALL IT AND TO ASK FOR ADDITIONAL FUNCTIONALITIES THROUGH THE RELATIVE FORUM. IntroductionThis module was born when a my colleague let me see the ZGDChart module, a module for Zope, to interface to GD library for the creation of varied type of charts. When I saw it, I have thought: "WebGUI must have an analogous module too!" What GDWGraph is?GDWGraph is a W(eb)object for WebGUI (http://www.plainblack.com/webgui) one of the most popular open source content management systems (CMS). Currently supports WebGUI release 5.5, 6.0, 6.1 and 6.2 under Linux with Apache and under Windows with IIS. With this component, you can build graphs with data available from external sources like:
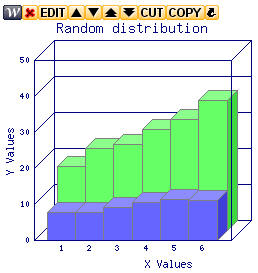
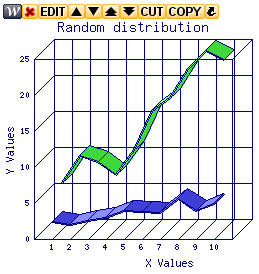
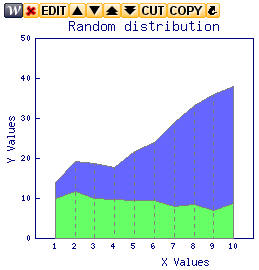
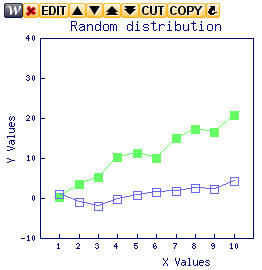
Here are some samples generated by this component.
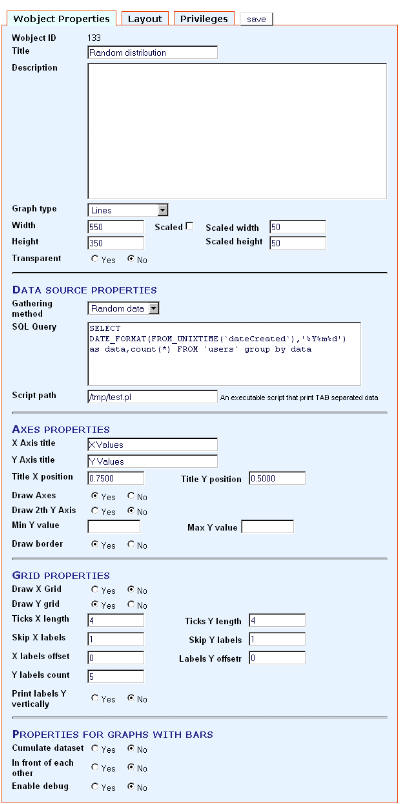
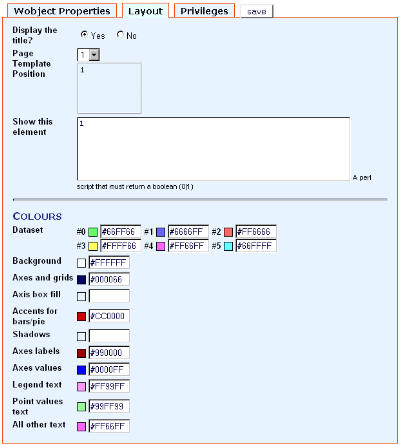
How to install it.Take reference to docs/GDWGraph/install.txt file for relative details to the installation. How to use GDWGraph.The data for the graphs generation can come from various sources. SQL Query.You can directly insert the SQL statements , in the relative field that will explode the possible macros inserted. The first returned field will be used for the X axis, the other fields will be used for the several series of values for the Y axis. External scriptA whichever script written in a whichever supported language can be used. The script will have to be executable on the server by the process under which the web server runs. The script will have to print on standard output (STDOUT) the plotting data, one line for every data. These data on every line will have to be separate by a tabulation character. The first element of every line will be used for the X axis, the other elements will be used for the several series of values for the Y axis. Layout configuration of the graphIt's possible to configure various layout elements of the graph. To have an idea, these are the screenshots of the WebGUI configuration for this object
To do.
Make a donationJavaScript Menu Courtesy of Milonic.com |
|
||||||||||||||||||||||||||||||||||||||||||||||||||||||||||||||||||||||
| Copyright© 1997-2006 Emiliano Bruni | Online from 16/08/1998 with |
Write me to:
|